
| Results | ||||||||||||||||||||||||||||||||||||||||||||||||||||||||||||||||||||
|
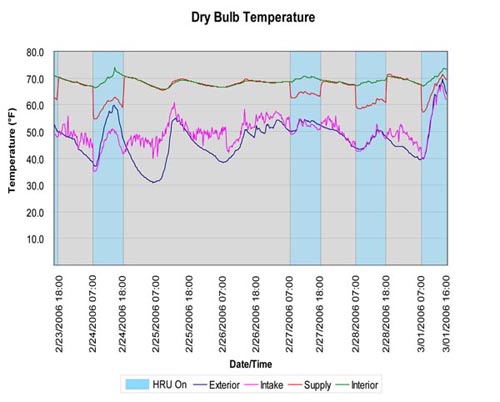
The dry bulb temperature at the supply collection point (red) clearly indicates when the HRU is operating. When the HRU is not operating, the temperature reading at the supply point approximately matches that of the interior collection point. The difference between the exterior and intake temperatures was more than we expected, since both were measuring unconditioned external air. The exterior HOBO was placed under the eaves on the south side of the building (to protect it from rain). It was lower to the ground and sheltered from the wind. The intake HOBO was placed within the hood of the roof cowl where it was elevated on the roof and experienced more temperature fluctuation due to wind. Its range of temperature readings was moderated by the microclimate around the building. The sharp rise in exterior and intake temperature readings on the last day of the study correspond to a rare warm winter afternoon.
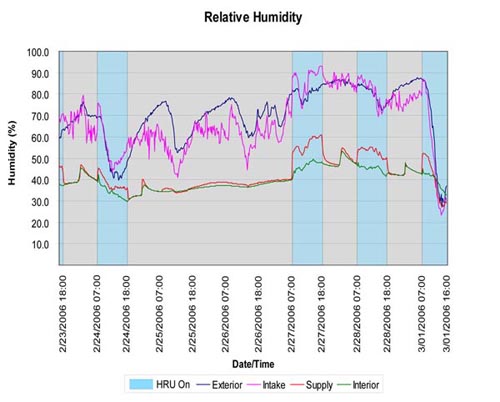
The relative humidity data do not correlate as strongly with HRU operation as do the dry bulb temperature data. It is a known shortcoming of the HOBO data collectors that relative humidity measurement is not as accurate as temperature collection. We deployed backup HOBOs at each collection point, but due to a shortage of U12 units, we had to use an older HOBO model for the backups. The variation in relative humidity readings between the new and old units exceeded 10% even though the units were placed within inches of each other. Rather than try to account for such disparate data, we chose to drop the data collected by the backup HOBO units from our study. The sharp drop in exterior and intake relative humidity readings on the last day of the study correspond to a rare warm and dry winter afternoon. The jaggedness of the intake curve can again be explained by wind exposure on the roof. The difference between intake and exterior relative humidity readings can be explained by the microclimates at the collection points.
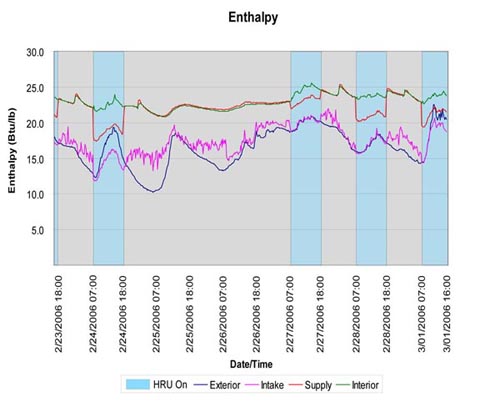
In order to determine the efficiency of the HRU enthalpy wheel, we needed to calculate the enthalpy of the air at each of the data collection points. Using psychrometric formulas obtained from http://www.kw-energy.com/psych.htm, we were able to calculate enthalpy using our dry bulb temperature and relative humidity data, and an assumed atmospheric pressure of 29.921 inches of mercury (as assumed on the psychrometric chart in MEEB) as inputs. The supply enthalpy curve clearly indicates when the HRU is operating. When the HRU is not operating, the enthalpy of the supply air is slightly higher than that of the interior air. The supply data collection point was on the diffuser, 12 feet above the floor, while the interior data collection point was on the wall, 4 feet above the floor. This difference in enthalpy is explained by the fact that warm air (air with greater enthalpy) rises. Data on the unusually warm afternoon is anomalous. The final step in our analysis was to calculate the efficiency of the HRU enthalpy wheel using the formula:
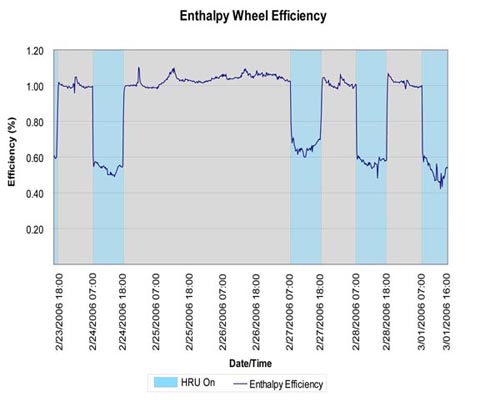
As we originally hypothesized, the data shows that the HRU is operating well below its rated efficiency of 80%. The table below shows the average efficiency for each day of HRU operation with an overall average efficiency of 57% over the four days. {Note: efficiency readings above 100% would seem to imply that the HRU is bringing in air of higher enthalpy than the room air. This is not really the case because these readings correspond with times when the HRU is not operating. The supply collection point is at a higher elevation in the room than the interior collection point. It makes sense therefore that it would show a slightly higher temperature (and enthalpy) since warm air rises.}
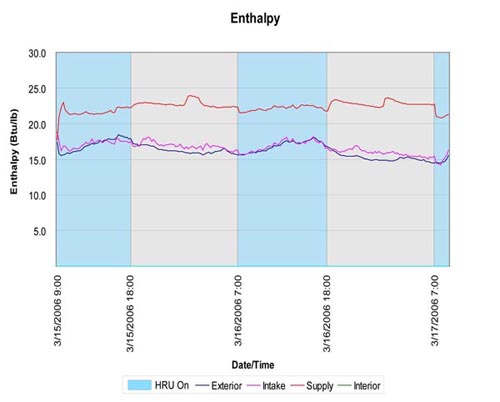
Although this confirmed our hypothesis, the plot thickened at this point. In our early conversations with Jack Yousey, the head consulting engineer for the Moss Street Children’s Center, he told us that a Siemens control system had been installed to regulate the operation of the HRUs and monitor their performance. The system was supposedly programmed to set off an alarm if the efficiency of the HRUs was measured below 70%. Since our independent data suggests that the south mezzanine HRU was operating at approximately 57% efficiency, we were of course very curious to acquire the Siemens control system data and find out if any alarms had indeed been set off. The facility services staff, who were very responsive and helpful in aiding our study up to this point, became difficult to reach. We informed them of our findings and asked if it would be possible to see the Siemens control system data. Unfortunately we were unable to connect. However, after several days one of the staff members contacted us to report that he had examined the HRU in question and found the filter to be in dire need of cleaning. He requested that we perform another test now that he had cleaned the filter. We were unable to obtain any Siemens control system data from the maintenance staff. Unfortunately our inability to connect with the maintenance staff ment we only had a small amount of time to collect new data. We ran the second test for two days. To our dismay, our follow-up data collection has come up incomplete. Unfortunately, the interior air temperature data collector took no readings, and we are therefore unable to calculate the efficiency of the unit. However, there are some ways to analyze the data we do have through which we can draw some fairly well-substantiated deductions. Our raw data is available here. The following chart shows the enthalpy at each data collection point.
By calculating the enthalpy of the supply air, we noticed that the enthalpy differential of the system when it is on versus when it is off has changed noticeably since the first trial. We began by looking at two 24-hour periods – one from the original data collection and one from the most recent test – that had a comparable range and variance in enthalpy. In each, we calculated the average enthalpy for four different categories: at the intake when unit was on, at the intake when the unit was off, at the supply when the unit was on, and at the supply when the unit was off. If the conditions at the intake during both days are comparable, then the on/off enthalpy differential of the supply for the two days could give us a clue as to whether efficiency had improved. What we found was that the differential for the original data was 3.2 Btu/lb, whereas the enthalpy differential of our most recent findings was 0.8 Btu/lb. This shows that the air being supplied to the room is now significantly closer in enthalpy to the ambient room conditions. Because the exterior conditions between the two periods are similar, this strongly suggests (though not conclusively) that the HRU is operating at a higher efficiency.
We can estimate efficiency as follows:
We can assume that the estimated efficiency is artificially high based on the following reasons: the enthalpy we used as a substitute for the interior enthalpy was the average of the enthalpy at the diffuser when the HRU was inactive, that is, at night. Because the nighttime exterior temperatures are generally lower, and the heating in the building is inactive during these hours, we can assume that the substitute enthalpy we used was too low. This condition results in a smaller enthalpy differential, and therefore a higher efficiency: 88%, which is 8% higher than rated efficiency, and a number the HRU manufacturer would be thrilled with. For this reason, we have lowered our estimate to 80%, leaving it still relatively high as the data does suggest that the HRU is operating at significantly higher efficiency. Because we lacked the interior data point, this must remain a theory, though it is encouraging and not entirely unsubstantiated. What we can conclude beyond a reasonable doubt is that backup data loggers are essential!!! |
||||||||||||||||||||||||||||||||||||||||||||||||||||||||||||||||||||
HOME | ABSTRACT | INTRODUCTION | HYPOTHESIS | METHODOLOGY | RESULTS | SUMMARY | REFERENCES"The Answer is Blowing in the Wind"A study of the Moss Street Childrens Center ARCH 591 Final Project University of Oregon For information please contact: Dennis Beyer [ dbeyer1(at)uoregon.edu ] Erik R. Bishoff [ ebishoff(at)uoregon.edu] Ady Leverette [ aleveret(at)uoregon.edu ] Brian O'Reilly [ boreilly(at)uoregon.edu] |
||||||||||||||||||||||||||||||||||||||||||||||||||||||||||||||||||||